MLS… Still Puny
For all the high priced and high profile talent MLS is bringing into the league, relative to the other major sports in North America (hi, Canada!), it’s still really, really tiny.
The release of salaries by the MLS’ Players Union (happened last week) usually provides a good excuse to break down what the league looks like financially. Last year, I did this plot (each subdivided segment is a player’s salary, each bar is a team).
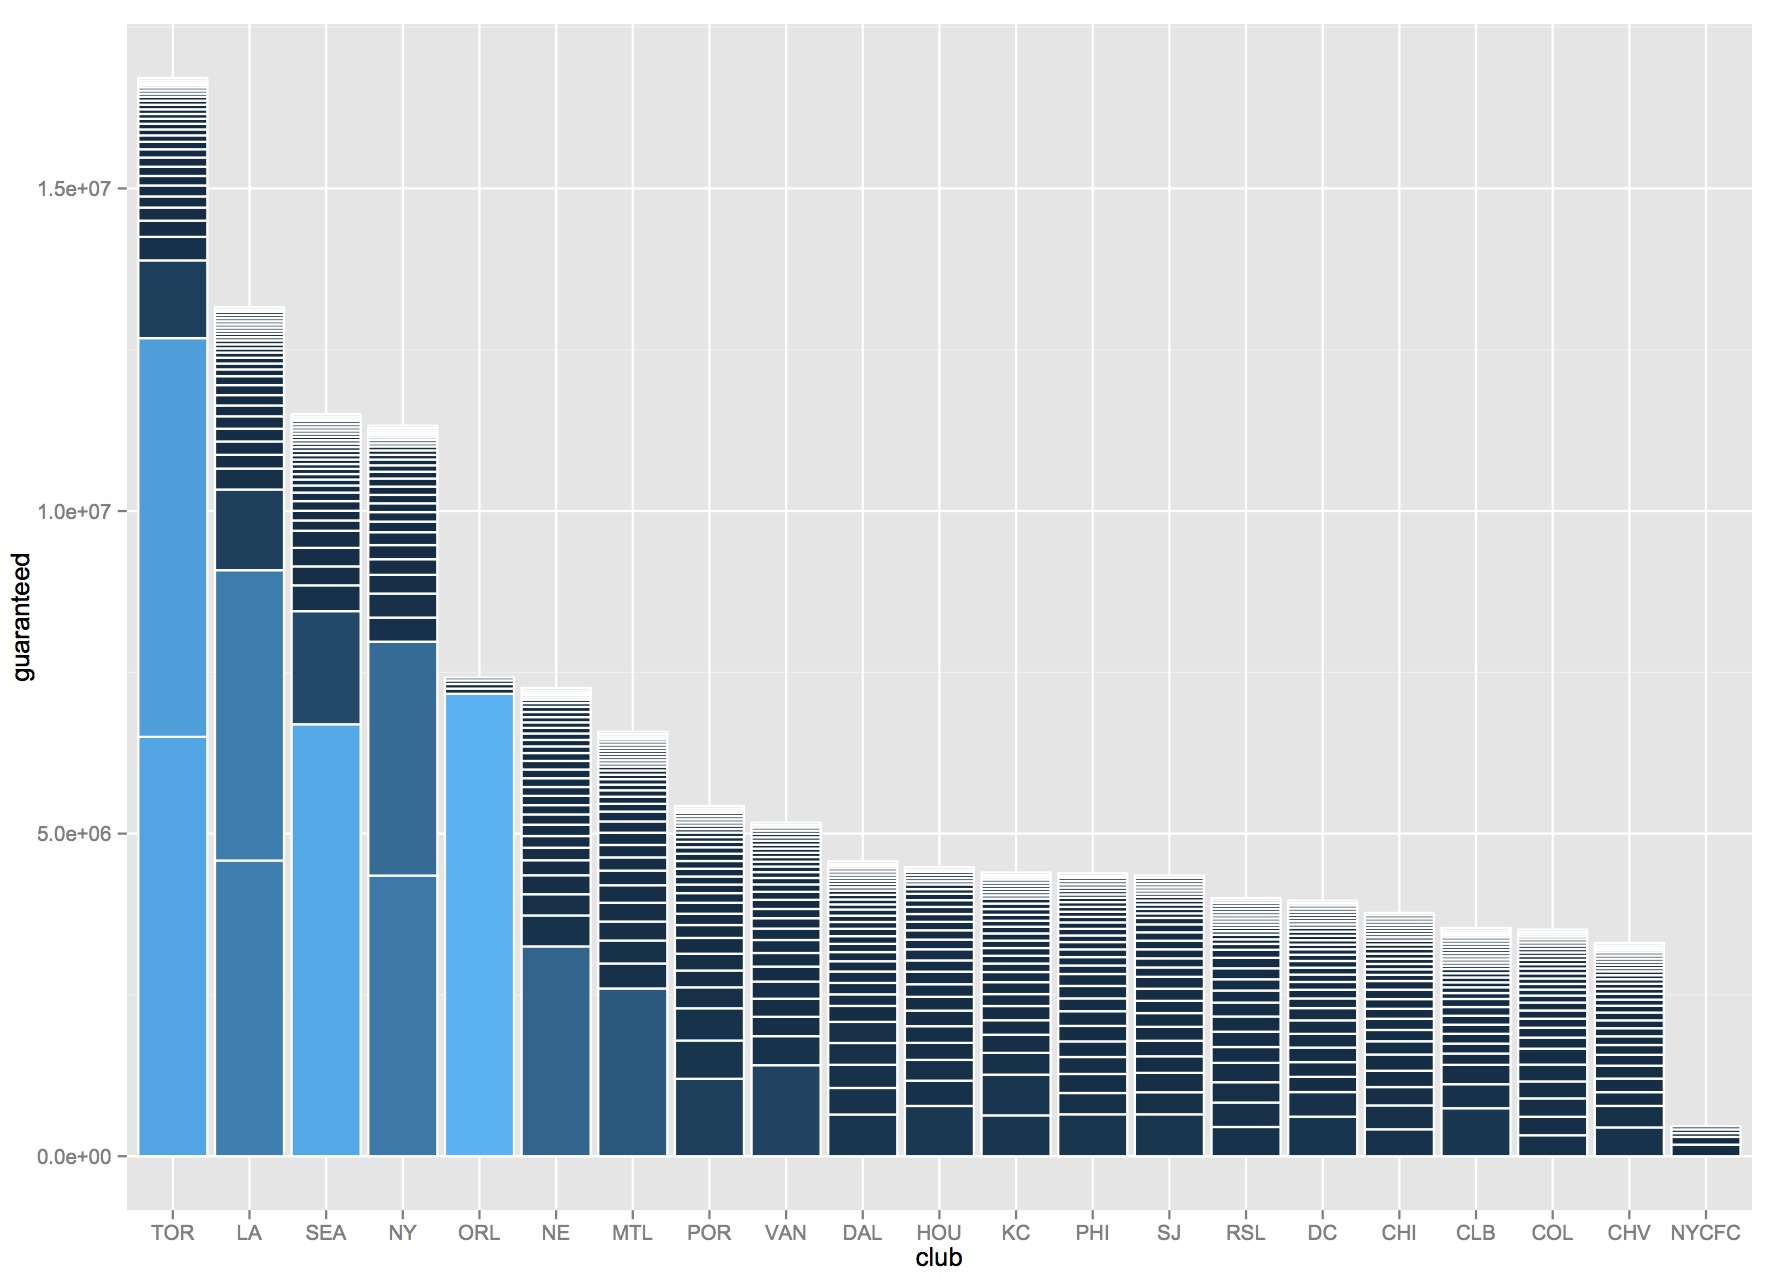
Thing is, qualitatively, it won’t have changed drastically this season. Even after you add huge blocks for Giovinco, Gerrard, Lampard, Pirlo and dos Santos, you still have to remove them for Titi, Cahill and Donovan. Swap the two New York teams’ spots and the graph would look mostly similar—a handful of players making lots of money, and most everyone else making lots less 1.
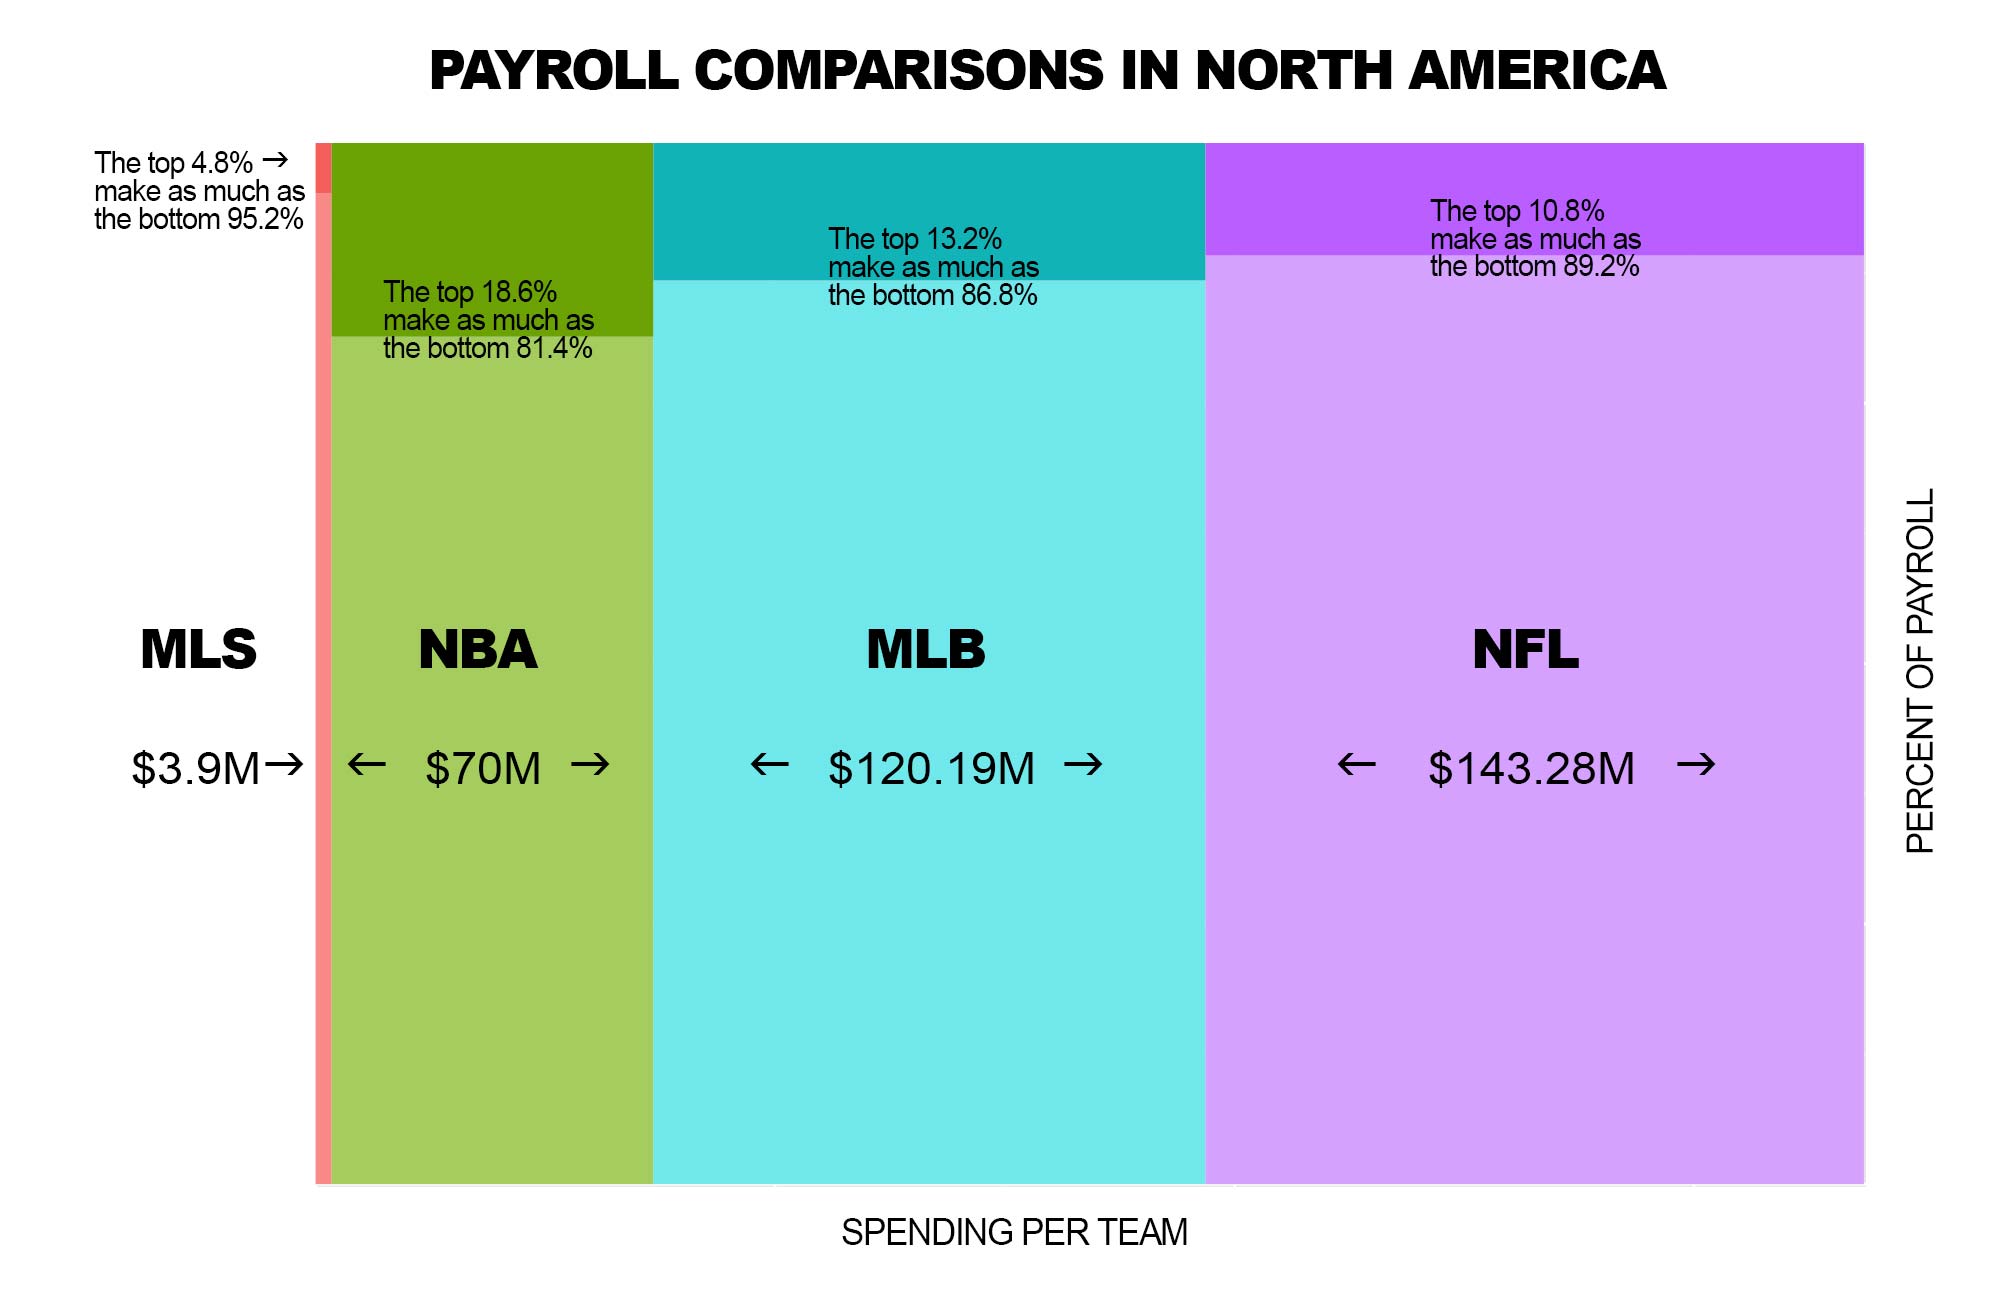
So for this season’s numbers, I decided to contextualize MLS relative to the NFL, NBA and MLB (there’s no NHL because I couldn’t find complete roster data that wasn’t going to take an inordinate amount of time to compile). This first graph uses salary cap numbers2. Again, the most obvious thing is that MLS is still very small. NBA rosters are about half the size yet teams still spend almost 18x on payroll by the cap number; the NFL, almost 37x.
MLS does pretty well at the gate, but its TV ratings are still piss poor. And without the huge TV rights fees, the league is going to have a hard time getting out of its lower class status.
The NBA’s next deal, starting with the 16-17 season, is for about $2.6B (that’s a ‘B’ for ‘billion’) per year. MLS’ most recent deal, which started this season and runs through 2022, pays about $90M per year. And that was seen as a mammoth deal for MLS where the fees more than tripled (the previous deal was for $27M). So MLS’ big boy contract is going to end up being 1/30th the size of the new NBA deal in terms of annual money.
In addition to being the smallest league by payroll, MLS is also the most top heavy. The dark region at the top of each column represents the salary equivalency percentage. In other words, at what percentages are the top earners and the bottom earners making the same total money. In MLS the aggregate salaries of the top 4.8% of the players is same total money the bottom 95.2% of the players. This isn’t surprising given the leagues use of marquee Designated Player signings.
The next closest concentration of wealth is in the NFL where the top 10.8% makes the same money as the bottom 89.2%. But the NFL isn’t really even that concentrated. It is right now, because right now rosters are still at 90-man. By the start of the season, those will be down to 53-man. If we cut the rosters to their 53-man limits (a bit of a hack as we’re just chopping off about the 40 cheapest players), the numbers for the NFL change a fair bit.
Moreover, in the NFL and NBA, the cap is something that’s supposed to limit teams’ spending. In MLS it’s this thing that the league gerrymanders more rules for in order to give teams ways to circumvent it. For example, if you use the guaranteed compensation numbers in the Players’ Union data, there is but one single team in MLS below the $3.9M cap (NYRB). Every other team is above it. Compare that to the NFL where there isn’t a team over the cap. Now the cap can vary a little bit from team to team based on carryovers and adjustments (for example, the Jags cap for the upcoming season is about $167M) but once you calculate actual spending, the movement isn’t very drastic compare to MLS, which basically doubles.
Below is the same chart only adjusted to reflect what teams are actually spending3.

And even after MLS doubles in size, it’s still really, really tiny compared to the other leagues.
1 The plot would indeed be pretty similar, but it might have been worth doing if only to point out that TorontoFC has three players—Bradley, Giovinco, Altidore—who are each making more than the total payroll of 5 teams. That’s not Bradley, Giovinco and Altidore combined, but each is making more than the total of five other teams (and it’s really close to six; if they could have gotten Jozy to an even $5M (a $250K bump), it would be nine teams).
2For MLB we used a trimmed mean, basically to mitigate a huge impact by the Yankees or Dodgers (as we’ll see in a bit it that impact isn’t particularly pronounced).
3 Here we used all 30 teams in the MLB calculations. You can see removing the outliers on either side actually didn’t move the needle too much.